Insight

2020: a difficult year – as told by electricity data

L’anno della pandemia e le restrizioni che l’hanno caratterizzato hanno avuto un risvolto sulla richiesta di energia. Per capire quale, c’è Il report annuale di Terna sui dati provvisori di esercizio.

2020 will go down in history as the year of the Covid-19 pandemic and how it profoundly changed our lifestyles. On the energy front, the epidemic deeply affected the entire planet, with many countries imposing restrictions on travel and economic activities, thus altering normal patterns of energy consumption and people's energy needs. The Terna annual report on the provisional operating data of the national electricity system clearly illustrates the impact of Italian government restrictions, comparing the differences in dispatching figures with 2019 data. These are provisional data, but they provide information that helps us understand the past year.

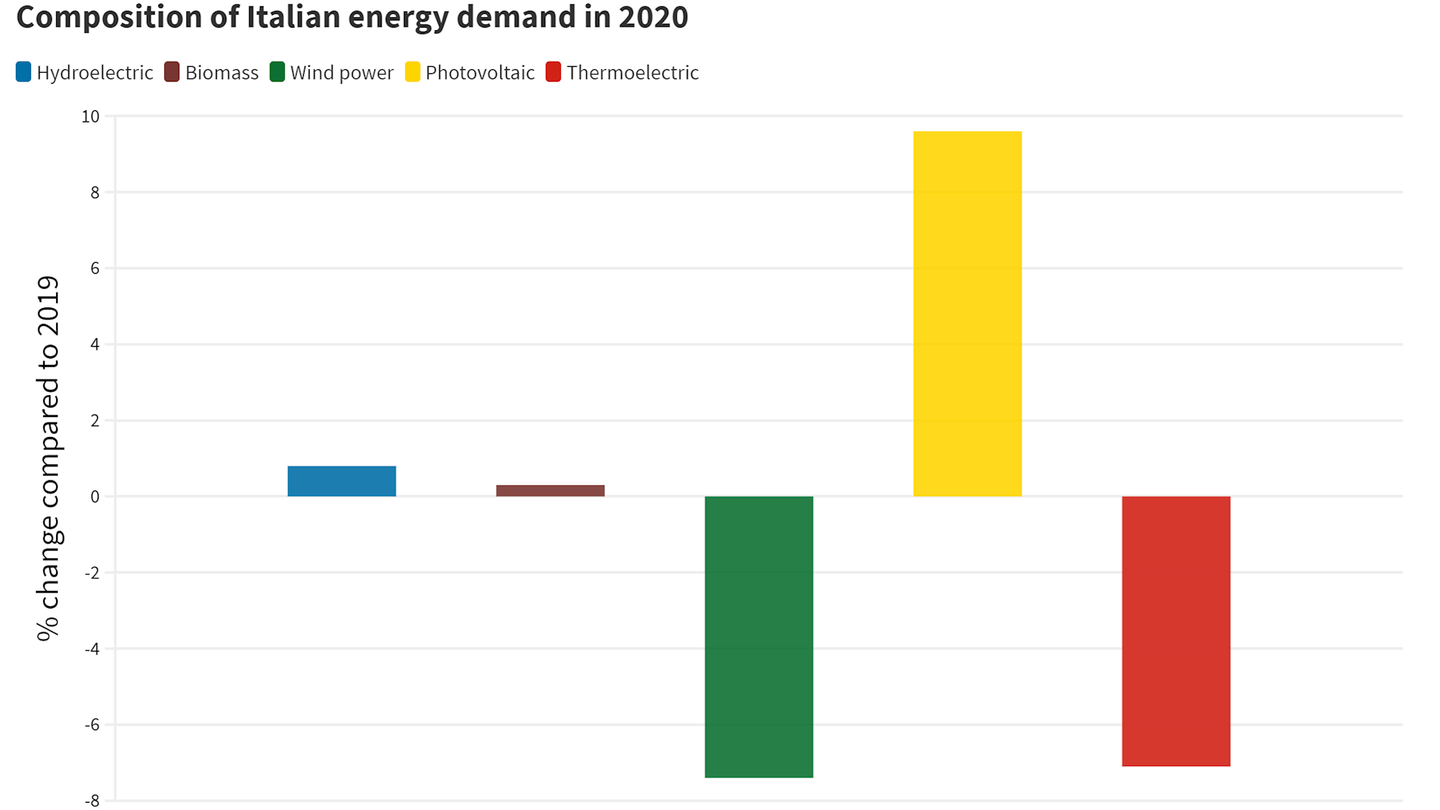
In 2020, Italian energy demand totalled 302,751 GWh, a 5.3% reduction compared to the 2019 total demand of 16,871 GWh. Unlike 2019, there was a slight increase in the share of electricity produced by renewable sources, with photovoltaics increasing by 9.6%, although other major sources such as wind power recorded decreases (-7.4%). Energy production from non-renewable sources decreased accordingly.
7750
Composition of Italian energy demand in 2020 (graphic processing of Terna data)

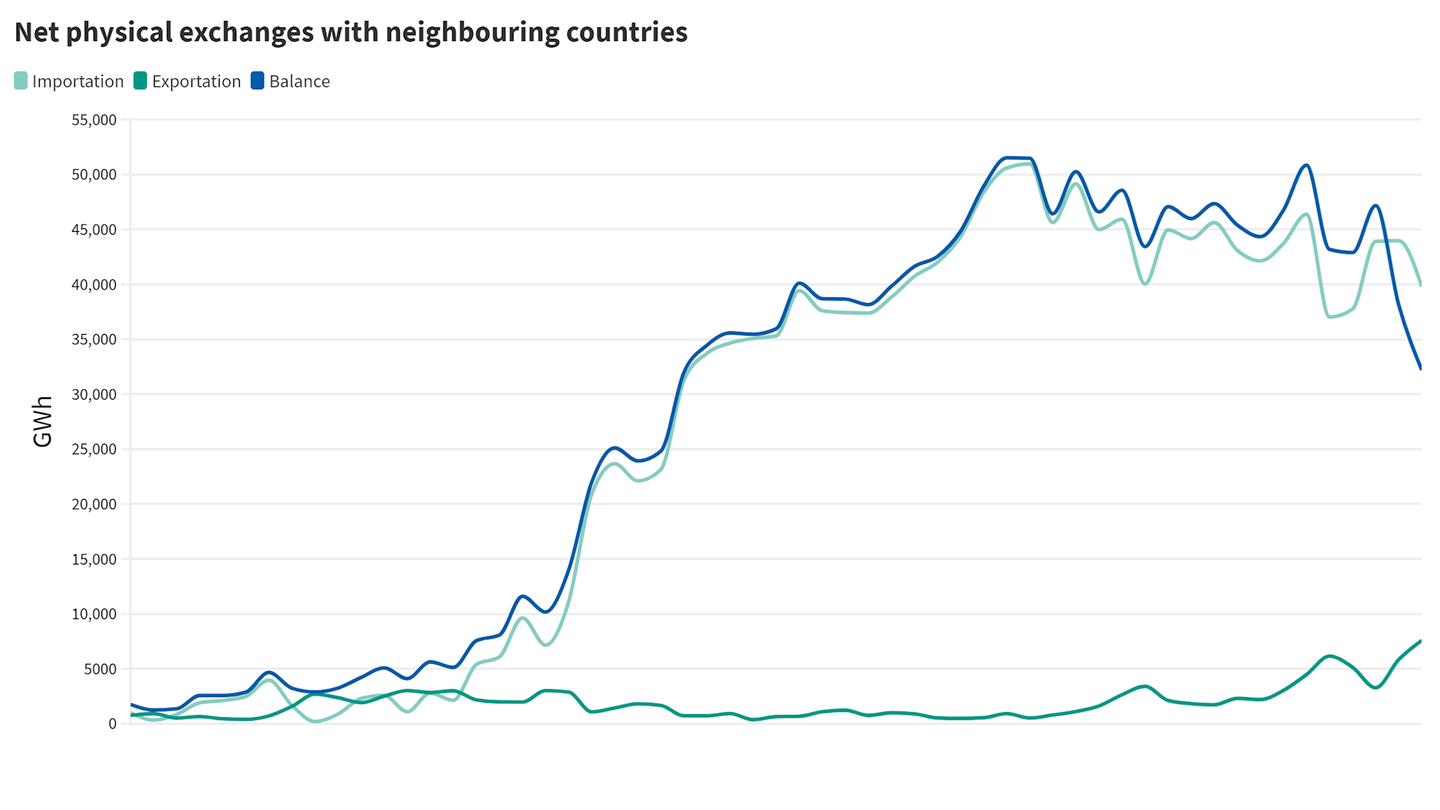
The reduction in energy demand also led to strong growth in our energy exports (+30.1%), returning the highest value recorded in recent years. On the other hand, our energy balance – calculated as the difference between imported and exported energy – fell to levels similar to those of the second half of the 1980s.

7751
Net physical exchanges with neighbouring countries (graphic processing of Terna data)

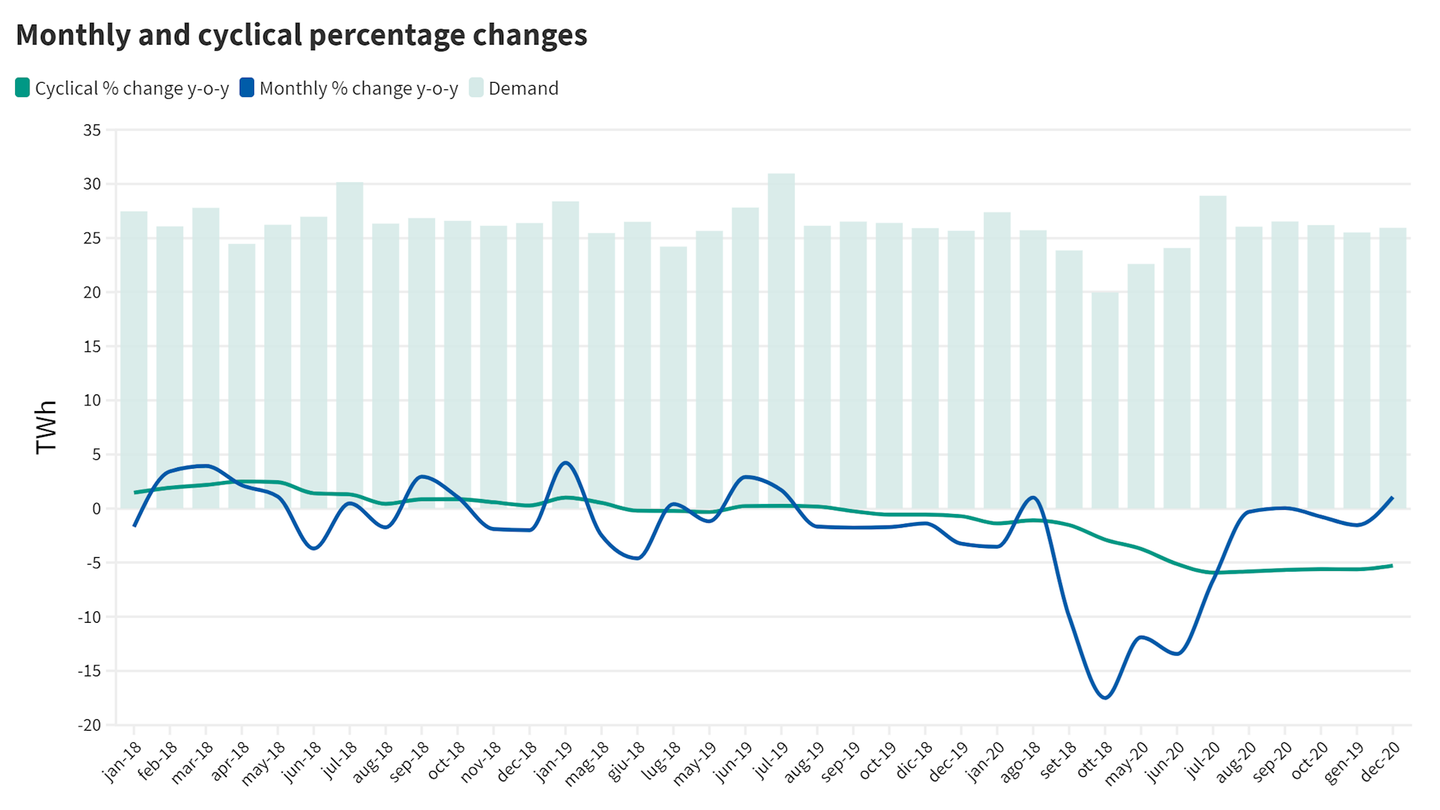
A more detailed look reveals how the restrictions directly affected energy requirements. The government decreed the national lockdown on 9 March 2020: the impact of this decision can be seen in the data for monthly changes in energy requirements, which fall sharply in March and April 2020 and only rise again to pre-lockdown levels around August. This sharp decrease in electricity demand – especially in “phase 1” of the lockdown (from 9 March to 3 May) – actually brought forward the coal phase-out scenario expected in 2025, leading to an extraordinary stress test for the National Transmission Grid.

The negative data recorded in March, April and May led to a significant increase in the amount of Italy's energy requirement produced from renewable sources, with a 47% share in March and April and a further increase in May to 51.2%, the highest monthly value ever.

7749
Monthly and cyclical percentage changes (graphic processing of Terna data)

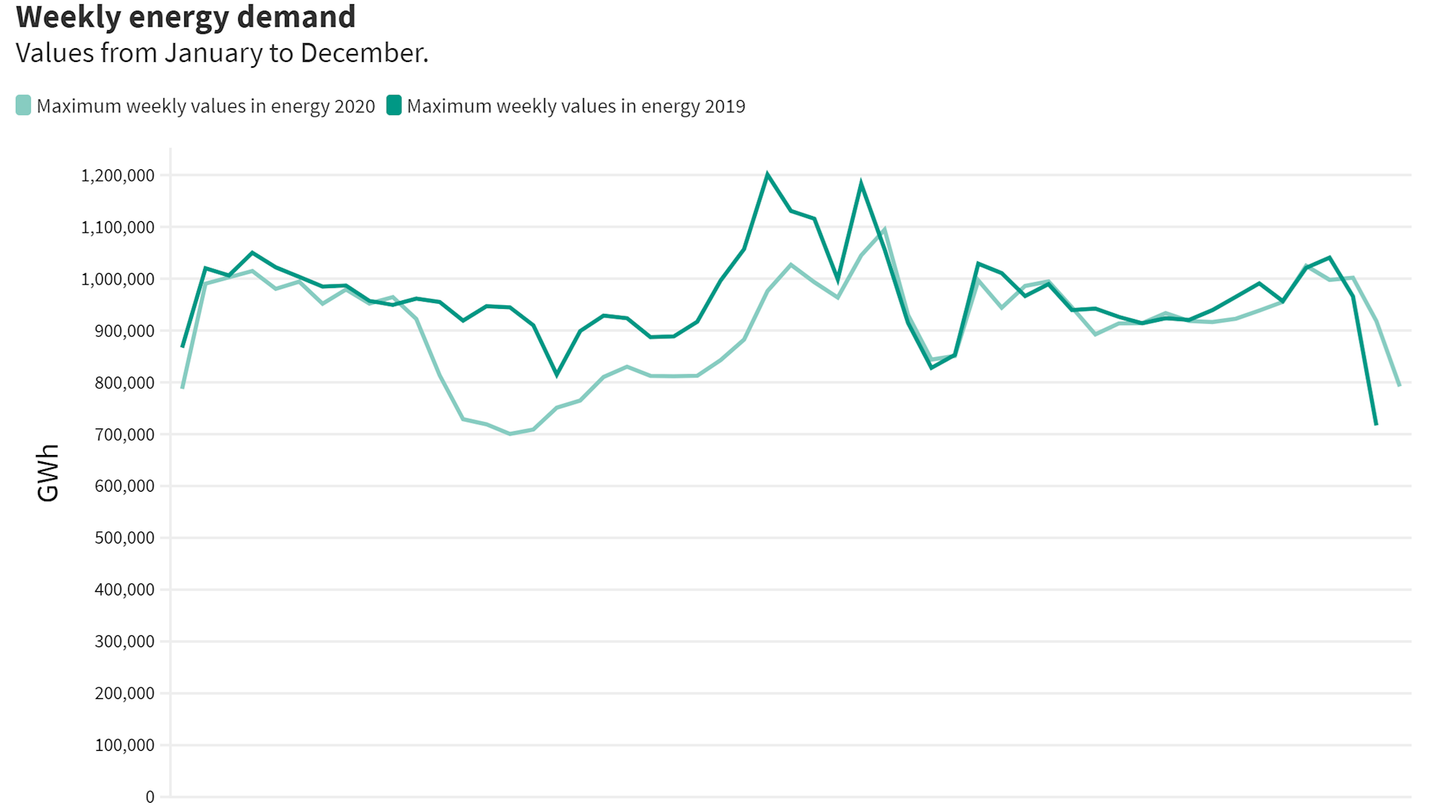
This difference is further visible in the weekly energy requirement curve, which presents the point-to-point trend in energy values for each week in 2020. During the lockdown period, the distance between the 2019 and 2020 curves widens, reflecting the lockdown and associated slowdown of some of the country’s business sectors, and therefore also energy consumption.

7764
Weekly energy demand (graphic processing of Terna data)

Looking at energy consumption data is therefore key in getting a snapshot of the changes taking place in the country and the unpredictable events that occur. Terna oversees the real time control of the National Electricity System, the execution of which also includes planned unavailability (of the grid and production plants) with different time horizons, the forecasting of national electricity requirements, acquisition of resources for dispatching and the checking of power transits for all the lines in the grid.

In addition to this delicate process there is a need also for increasingly flexible management of resources on account of the variable represented by “non-programmable” renewable sources. The pandemic has therefore further emphasised the importance of efficient management of the national energy network – not least to be able to deal with major emergencies.